
The atmospheric turbulence is a random and continuous medium. The volume distribution is generally descripted as the turbulence profile (TP), which includes several discrete layers and in each layer, the height, Cn2, wind speed and wind direction are stored.
Thanks to the site monitoring team from all over the world, we can measure the turbulence in a very high resolution both in the vertical direction and the time domain, such as stereo-SCIDAR measurements from optical turbulence group from CFAI Durham.
https://www.dur.ac.uk/cfai/sitecharacterisation/sscidar/
If you have enough turbulence profile data from both the vertical direction and the time domain, you can build your own atmospheric turbulence data cube as shown below:
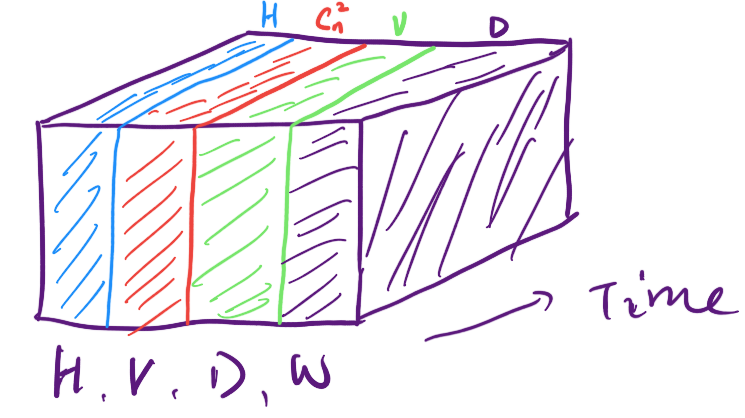
In this cube, the 4 dimensional data are height(H), refractive index structure function (Cn2), wind speed(V) and wind direction(d). It is a good example to apply the Machine Learning (ML) algorithm to show the information inside this cube.
TP Temporal Variation Description with GMM
One test is use a statistical model to describe the TP and with the description and the observation time of TP, we will get a 2D distribution as shown below:
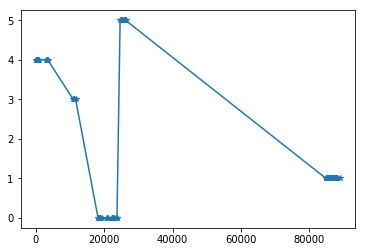
The x axis is the observation time and the y axis is the label of the TP.
We can use GMM to describe the TPs and get the labels of them through clustering. It includes the following 4 steps:
1.Data normalization.(Normalizing Cn2, Interpolating the wind speed and direction, Set all the TP with the same size through adding zeros in the first dimensions)
2.Data Stack. (Place all the data into a vector with size of N*M, where N is the number of TPs and M is the total dimension of them.)
3.Selecting number of Components. (Through calculation of AIC or BIC to get best number)
4.Traning GMM with stacked data.
Artificial TP Generation
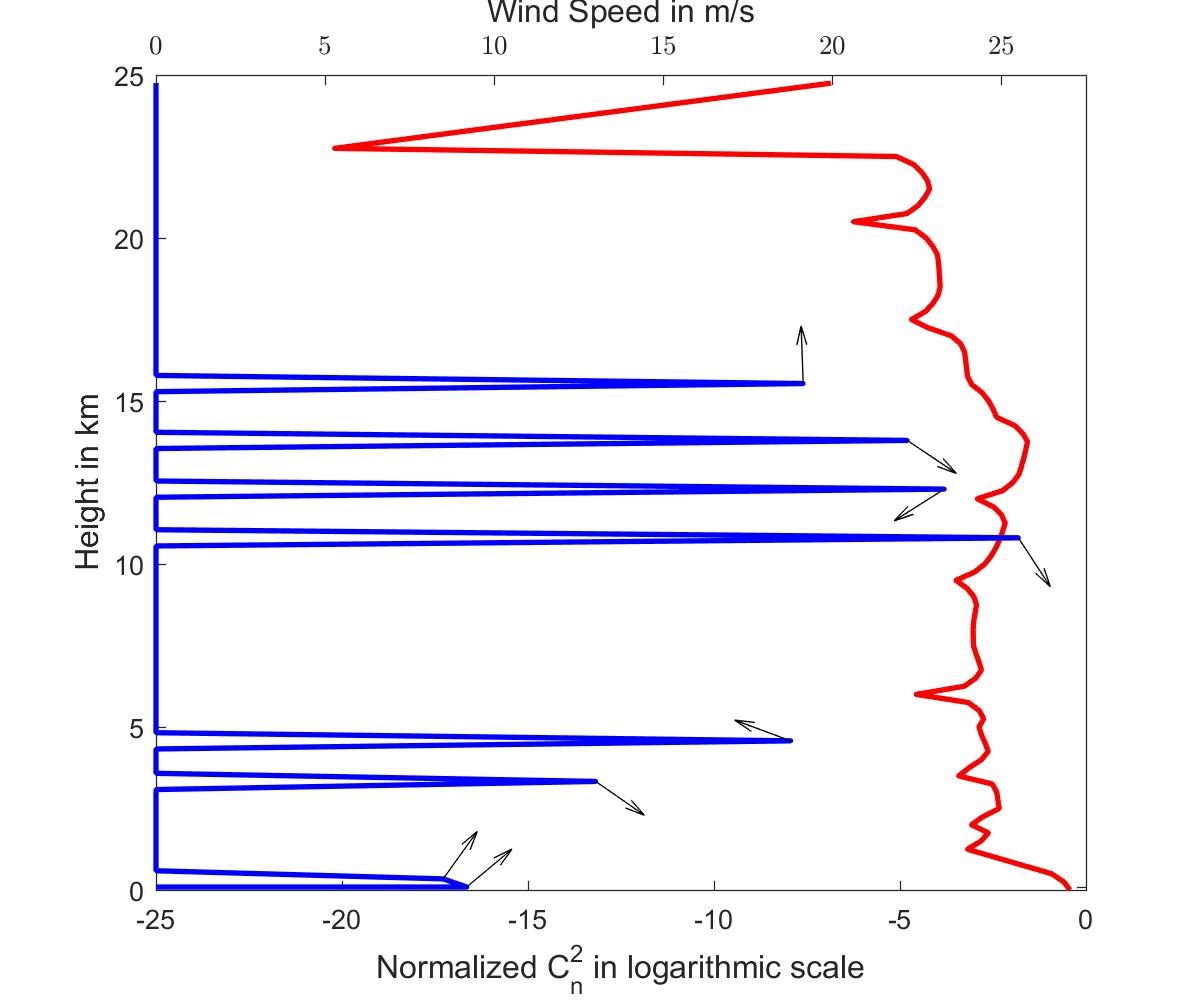
Since the GMM is a generative model, we can generate infinite number of TPs from a trained model. The Cn2, wind speed and wind direction profiles are shown below:(Red for Cn2, Blue for wind speed and arrows for the wind direction)
TPResults
The complete procedure can be found in my paper:
Jia Peng, James Osborn, Kong Letian,Douglas Laidlaw, Caifeng Li, Ollie Farley, Xue Gang, Modelling Synthetic Atmospheric Turbulence Profiles with Temporal Variation using Gaussian Mixture Model, Monthly Notices of the Royal Astronomical Society, 11/2018.
The code used in that paper can be downloaded below: